Properly introducing... hubReports
I’ve finally released a version of my github report site "hubReports" that I’m happy with. This post covers how this little side project came into being, what it grew into and where it’s going.
Early version
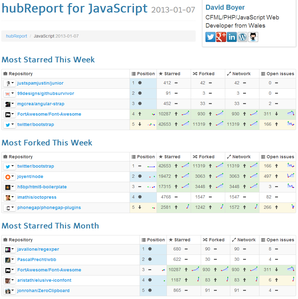
Back in November 2012 I was playing around with the github API to try and monitor new CFML based projects for my open source update posts. I liked the idea of tracking some of the statistics (stars / forks) available for each repositories and the idea of “charts”, for example: Top 20 Starred repositories overall. This spawned a little side project, resulting in reports like this:
Originally it was a manually executed job, written in ColdFusion, run on a weekly basis. It produced a set of static HTML reports with trends shown as sparklines for each aspect. Eventually I had it monitoring 5 selected languages.
The alpha
From there I started rewriting it with the idea of running it daily. I also took the opportunity to learn something new and threw NodeJS, MongoDB and AngularJS into the mix. Things went well and I had a few early alpha versions but the hosting I was using had some issues that prevented me taking it much further.
After that, I went idle for a while. I took some time to learn more about NodeJS and saw some changes planned for the github API that would be of use to me. Then came the current iteration of the project…
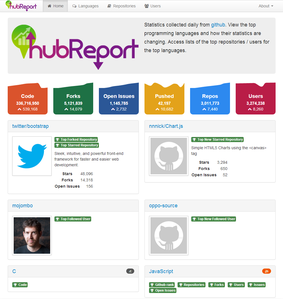
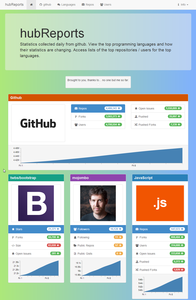
hubReports!
http://hubreports.yougeezer.co.uk
- Runs a data collection task against github on a daily basis.
- Attempts to cover all languages that github considers “programming”.
- Every language has basic statistics tracked and made available.
- Based on those statistics, a set of top languages is determined (plus some just picked by myself :P).
- Each “top language” is delved into further, looking at repositories and users.
- Top 15 charts based on various aspects, are collected.
- Each entry (repo or user) in those charts are also tracked.
This does mean that you might not find yourself on the hubReports site as I only monitor those who appear in the charts. I haven’t got access to enough API calls and storage to monitor everything ;-)
Future
Upcoming features
There are still some features I’d love to add to the site and currently working on. They include stuff like:
- Language comparisons: Select two (or maybe a few more) languages and compare their statistics as they stood that day or since they’ve been tracked.
- Improved “Charts”: The top language / repo / user charts need some more attention. I’d like to add something like a heat map or an “amount of change” value / indicator. This would be handy for seeing how an item may be climbing up faster than others in the charts.
- Public Gists statistics: Kind of a bug at the moment, a users public gists should be monitored but isn’t since the count is only available in the “beta” part of the github API. I’m still deciding if I’ll take the risk and use the beta or stick with their main API, waiting to see what they release down the line.
- Achievements: Each language, user and repository that’s monitored will have achievements calculated for it, like personal best records. An example would be an area showing the top chart position they’ve ever achieved and how long they reigned or their maximum stars / forks.
- Weekly Language Newsletters: After the achievements system is smoothly rolled out, I’d like to package that information up along with other stuff into a weekly email newsletter, for each of the “Top / chosen languages”. These would be opt-in email lists that’d receive the auto-generated newsletter, possibly with some additional content from someone with knowledge of the language in question. There’d probably also be a global one, not tied to a single language.
Budget - Currently Zero! (for now…)
Apart from the my spare time I’ve managed to avoid having to pay out anything. The site is running on OpenShift, which provide 3 “gears” for free. 1 instance runs the MongoDB for storing all the information collected and the other 2 host the NodeJS based application. It’s an awesome service and I’m so grateful that it’s available for trying out little projects like these. There are two factors to note. If the site gets too popular, it may struggle to cope. My OpenShift setup runs on a single gear currently and set to scale up to 2 if things get busy. After that point, it’s all down to optimising the code further or working out how to cover the cost of scaling further. The other issue is data retention. At some point down the line, MongoDB instance will hit its allowance and stop accepting any more data. From there on, I’ve some tricks to compress the data down, remove non-changing statistics where I can but they’ll only carry me onto a certain point. After that, certain repositories and users will have to be removed if they haven’t been seen in the “charts” for a long enough period. Finally, older data would have to be expired or costs will be involved. Why am I rattling on about this? Just so people know that the site could go through some teething issues or even disappear if it can’t scale up to the task. Not due to my lack of trying ;)
Feedback
Go on! Give me some feedback! I’d love to hear what you think. The whole project was spawned out of a little need of mine, plus a desire to try out NodeJS, MongoDB and AngularJS. But if anyone finds it useful, or thinks it could be with a few additions or changes, let me know. You can leave comments on this blog post, use my contact form or fill out the survey after visiting the site itself.


